Thanks to all the participants for your help, the Isothermal titration Calorimetry Data Analysis contest is already closed. The participants in this contest had the opportunity to demonstrate their ability to propose the right model for a given binding isotherm as well as to get the corresponding parameters upon fitting using AFFINImeter. On their side, less experienced participants had the opportunity to:
The participant that provided the most accurate and reliable analysis amongst all the participants in our challenge was Professor Deborah Yablonski Rappaport (Immune Cell Signaling Lab of the Faculty of Medicine in The Technion – Israel Institute of Technology).
The data proposed for the contest will remain available here, in case you want to learn more about it or to try it by yourself. The material prepared to guide the participants through the two steps are available in our blog. But if you want to go directly to see the solution just keep reading and follow the corresponding video of the solution for each step of the contest.
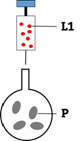
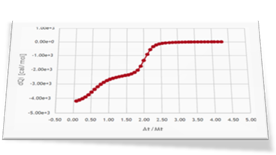
Dr. Brooks started his investigation with a standard ITC experiment (curve 1) where the primary ligand L1 is titrated into the sample cell with the receptor protein. From this experiment, he wants to get thermodynamic and structural information of the interaction. Fortunately, we count with some preliminary information that will make the analysis easier:
Preliminary information:

STEP 1: Solution
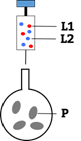
It consists of a standard protein-ligand binding ITC experiment where a ligand solution, initially located in the syringe, is titrated into the sample cell containing a protein solution.
The solution is not straightforward since the protein is able to simultaneously bind up to two ligand molecules. Another important aspect of the experiment is that the concentration of the active protein is not accurately known (this is not uncommon in an actual experiment). In this case the active protein concentration is known to have an uncertainty of 10%. Thus, the parameter rM (available in AFFINImeter just to correct for the concentration of the compound in the sample cell) is also expected to be fitted, in addition to the equilibrium constants and the enthalpies of the thermodynamic processes. Since no ligand dilution blank experiment was performed the Qdil parameter (the dilution molar enthalpy of the injected compound) should also be fitted. Finally, two different approaches are available in AFFINImeter to analyse these data, namely “stoichiometric equilibrium” and “independent sites” approaches (Go to site to download files). It is instructive to perform the analysis in both ways to compare the results.
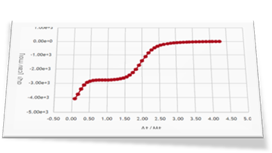
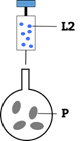
As a second step of the investigation Dr. Brooks performed three more ITC experiments: an experiment of L2, the weak ligand, titrated into the protein sample (curve 2) and two competitive experiments where a mixture of L1 and L2 is titrated into the receptor protein solution (curve 3 and curve 4).
Preliminary information:
STEP 2: Solution
Four different binding isotherms involving one or two ligands able to simultaneously bind the protein are expected to be globally fitted in this step. This can be easily done in AFFINImeter by linking parameters (equilibrium constants and enthalpy changes describing the same binding event) between different curves. To understand this step we strongly recommend you to read this post where we explain how to perform the global fitting analysis.

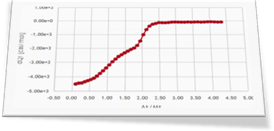
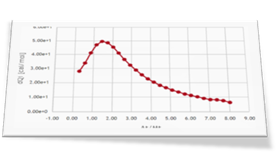
Isotherm Preview
Isotherm Preview